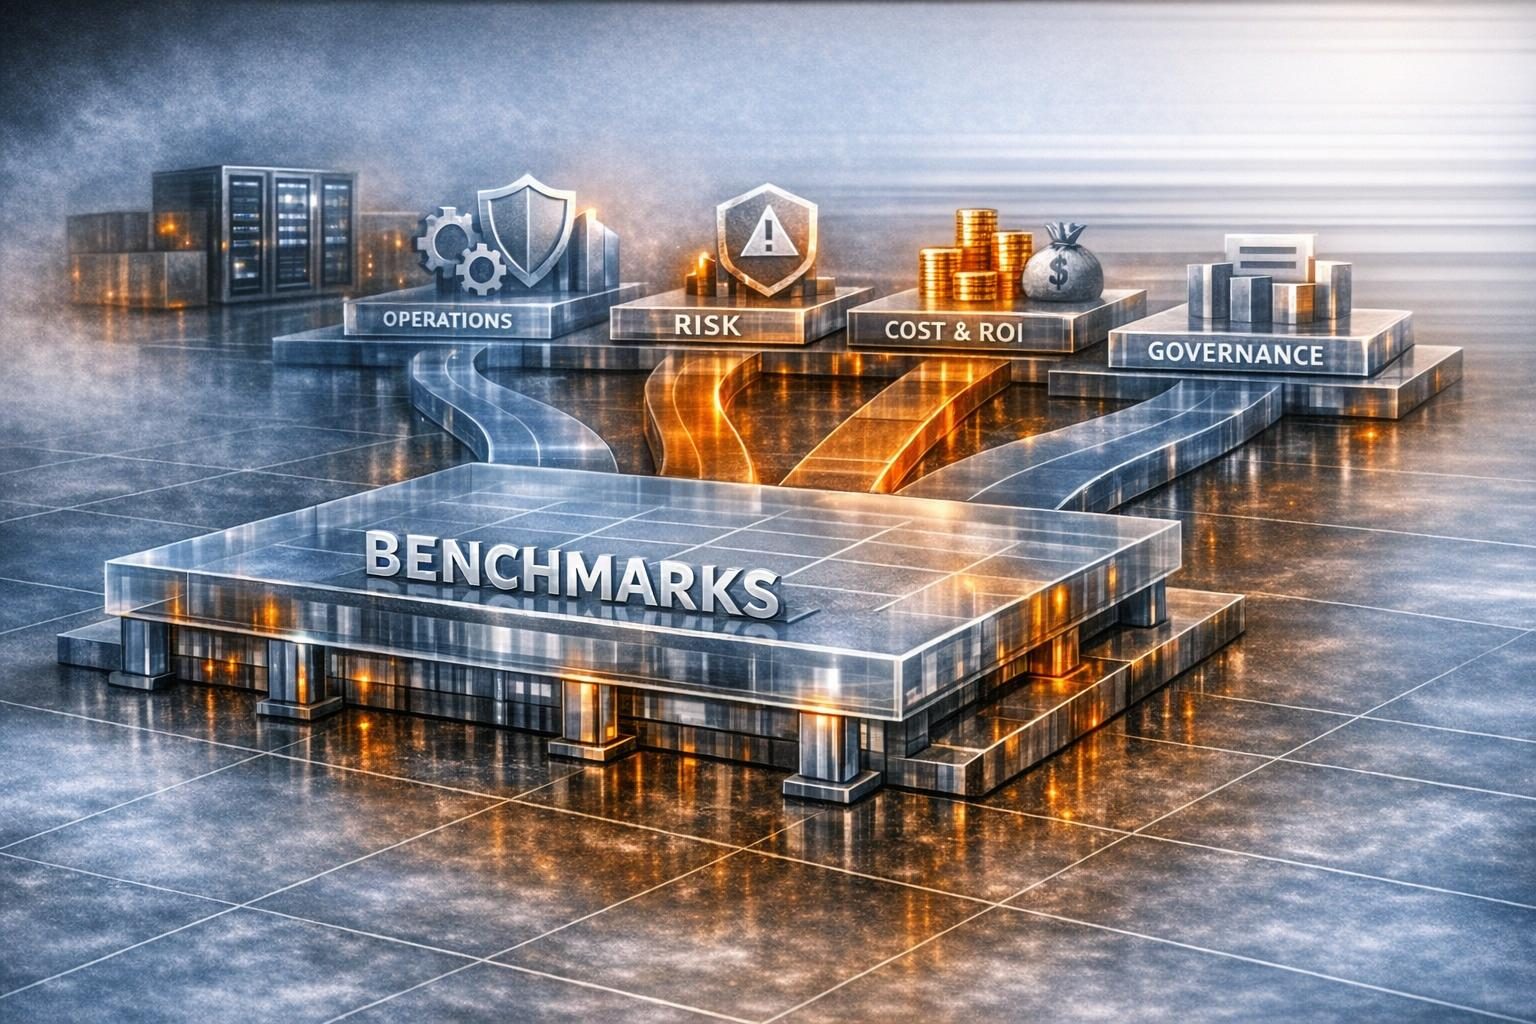
llama.cpp ships its own benchmark tool, llama-bench. It reports prompt processing (pp) and text generation (tg) as average tokens per second with a standard deviation across repeated runs, and it leaves out tokenization and sampling time. A llama.cpp benchmark result is only as good as the build and flags it ran with. In one server comparison, build and configuration changes moved the numbers more than the choice of engine did. The rest of this article covers how each of those factors bends the result, and when a clean number can be trusted for a production decision.
Does llama.cpp Have a Built-in Benchmark, and What Does llama-bench Measure?
llama-bench runs three kinds of test. Prompt processing (-p) processes a prompt in batches. Text generation (-n) generates a sequence of tokens. The combined pg test processes a prompt and then generates. Each test repeats -r times. The tool averages the results and reports the standard deviation, and some output formats, JSON among them, also keep each repetition’s figure. The -d <n> option runs a test at a given context depth by prefilling the KV cache with n tokens first.
The two headline numbers answer different questions. Prompt processing matters most for long documents, codebases, agents and lengthy conversation histories. Token generation governs how fast an interactive chat reply appears. They also hit different hardware limits. An on-device study found that prefill throughput grew roughly linearly with CPU cores while decode barely moved, which fits prefill being compute-bound and decode being bound by data movement. A single-stream GPU comparison found decode bound by memory bandwidth with one request in flight. A single “tokens per second” figure that does not say whether it is pp or tg is therefore incomplete.
Because llama-bench excludes tokenization and sampling, its figures leave out part of the end-to-end time. For a fuller view of what LLM inference benchmarks measure and how to read them for deployment, including latency metrics llama-bench does not report, see that companion piece.
Warm-up, Repeats and Variance
The more careful published LLM benchmarking methods discard cold-start runs and repeat; Mozilla.ai also reports the spread as well as the mean.
- Warm-up. One on-device evaluation pre-warmed llama.cpp with three preliminary runs before measuring, then fixed temperature and seed and cleared the KV cache before each of three measured runs.
- Repeats and trimming. Mozilla.ai’s server comparison took 15 runs per point, threw away the first as warm-up, dropped the two fastest and two slowest of the remaining 14, averaged the middle 10, and drew error bars at one standard deviation.
- Interleaving. The same Mozilla.ai test restarted servers before each run and interleaved the engines under test, so slow drift in machine state could not favour whichever went first.
- Simple averaging. An iPhone study averaged five independent runs per configuration.
We would treat the standard deviation as part of the result, not a footnote. Two configurations whose means differ by less than their spread have not been shown to differ, however the table is sorted. Turning a trustworthy number into a baseline you can re-run after every change is the same discipline applied over time, which the piece on turning local LLM numbers into regression baselines covers.
Why a llama.cpp CUDA or ROCm Benchmark Can Be Wrong
Ian L. Paterson puts the rule most clearly: a llama.cpp benchmark only means something if it ran against the build you will actually ship.
A Binary Built for a Different GPU
By default llama.cpp builds for the hardware attached at compile time. A build with GGML_NATIVE=OFF runs on all CUDA GPUs but may need some just-in-time compilation. When a binary has no native machine code (SASS) for the card it lands on, the NVIDIA driver compiles the embedded PTX at runtime instead. The card works and the throughput looks believable, but it is running a slow fallback. In Paterson’s case, a binary built for a Maxwell Quadro M4000 running on a Turing RTX 2060 SUPER gave 52.8 tokens per second for generation. After a native rebuild with CMAKE_CUDA_ARCHITECTURES="52;75" it gave about 62.5, roughly 19 percent faster. Prompt processing more than tripled, from about 106 to about 348 tokens per second.
A health check would not have caught this. “Health: ok” means the server started, not which kernels it started with. The confirmation is in the startup log: the device named correctly, all layers on the GPU, and no line about runtime recompilation. The same build also exposed a packaging trap. NCCL defaults to on, so a single-GPU binary linked against libnccl.so.2 passed in the benchmark container and then failed to start in the slimmer runtime container. Setting GGML_CUDA_NCCL=OFF is correct for a single card anyway.
Stale CMake Cache Entries and Toolkit Versions
On Blackwell cards, one write-up found two causes of degraded llama.cpp performance. Building with CUDA Toolkit 13.1 crashed the Blackwell MMQ kernel or degraded performance. A FORCE_CUBLAS=ON setting left in the CMake cache disabled MMQ altogether. The second persists across rebuilds. Early Blackwell support (before llama.cpp b8157) needed -DGGML_CUDA_FORCE_CUBLAS=ON as a workaround, the setting persists in CMakeCache.txt, and re-running cmake -B build does not overwrite it. It has to be set to OFF explicitly, or the build directory deleted. The measured gap between the MMQ and cuBLAS paths was 5.7 to 6.3 times on prompt processing and 1.4 times on text generation. The same write-up cites NVIDIA’s migration guide as recommending CUDA 12.8 for SM120 builds.
The official build documentation describes both kernel paths. MMQ kernels are on by default on GPUs with int8 tensor cores. Forcing FP16 cuBLAS raises memory use and can cause numerical overflow on some cards, though it may speed up prompt processing on recent datacenter GPUs, since the custom kernels were tuned mainly for RTX 3000 and 4000. Each path has its own trade-offs. What matters is knowing which path your benchmark used.
Flags and Toolchains That Move Results More than the Engine Does
Mozilla.ai compared llama.cpp, llamafile, LM Studio and Ollama with the model and machine held fixed. All four landed within a few percent on prompt processing, because they all run the same llama.cpp core. The large swings came from how each was built. llamafile’s shipped CUDA backend had been compiled without CUDA graphs, and turning them on improved decode by 16.8 percent on a 0.8B model, 6.5 percent on 9B and 4.3 percent on 27B. Rebuilding the same commit against a newer Vulkan shader toolchain on a Steam Deck raised prompt processing by 25.9 percent on 0.8B and 63.3 percent on 9B. NVIDIA reports up to 1.2 times speedup from CUDA graphs for Llama 7B on H100 at batch size 1, with the benefit growing as models get smaller and GPUs faster, and graphs are now on by default for that case. The same reasoning applies to an Ollama benchmark, since Ollama runs the same llama.cpp core.
The ROCm Side
AMD documents llama.cpp on ROCm as part of its LLM Extension toolkit, with an AMD-Ecosystem repository and quantisation from 1.5-bit to 8-bit integers. For HIP builds, leaving out GPU_TARGETS builds for all GPUs in the current system. So a ROCm build is either AMD’s or upstream, with GPU targets explicit or inherited. We would record which one it was as carefully as the card model. None of our sources gives a measured upstream-versus-fork gap, so we make no claim about its size.
How Should llama.cpp Be Benchmarked Across Multiple GPUs?
Benchmark each split mode against a single-GPU baseline on the same model, and report pp and tg separately. llama.cpp’s multi-GPU documentation lists three modes, set with --split-mode (-sm): none (one GPU only), layer (the default, pipeline parallelism where each GPU holds a contiguous slice of layers and their KV cache), and an experimental tensor mode that splits weights and KV across GPUs. llama-bench accepts -sm with none, layer, row and tensor options.
The documentation spells out the trade-off. Layer mode minimises cross-GPU transfers, tolerates slow interconnects and favours fast prefill, but needs many tokens to scale. Tensor mode performs several cross-GPU reductions per layer, targets fast token generation and depends far more on interconnect speed. One set of measurements lines up with this. XiongjieDai’s comparison across NVIDIA cards and Apple silicon found that multiple NVIDIA GPUs might hurt text generation while still boosting prompt processing.
When Splitting Stops Paying Off
When multi-GPU performance comes out worse than a single card, the llama.cpp documentation names GPU interconnect speed as the bottleneck. Its suggested fixes are to check that NCCL is in use for tensor mode, try layer mode, or add PCIe lanes or NVLink. A multi-GPU build without NCCL prints a one-time warning that performance will be suboptimal. CUDA peer-to-peer transfers are opt-in through GGML_CUDA_P2P, usually need workstation or datacenter GPUs, and can crash or corrupt outputs on some motherboards, for example with IOMMU enabled. For multi-GPU pipeline-parallel setups, the build documentation suggests considering CUDA_SCALE_LAUNCH_QUEUES=4x to improve prompt-processing throughput.
The documentation points to two cases where splitting pays off. The first is when the model needs more memory than one card provides. The second is when the workload is dominated by prompt processing. For a model that already fits and a decode-heavy chat workload on PCIe-connected consumer cards, expect little gain or a loss. The LLM-Inference-Bench study also found weak llama.cpp scaling with GPU count and an incomplete tensor-parallel implementation. The current documentation lists tensor mode as experimental. Re-measure on the commit you run rather than relying on either source alone.
How Does llama.cpp on Apple Silicon Compare with Discrete-GPU and CPU-Only Setups?
The hardware classes only compare fairly when the model file, quantisation, prompt and generation lengths, thread count, offload setting and llama.cpp commit are identical. Even then, in the one device study the CPU-versus-GPU winner changed with model size. Several factors work against a fair comparison.
Memory caps on Apple silicon. XiongjieDai notes that only about 70 percent of unified memory could be allocated to the GPU on a 32 GB M1 Max, with around 78 percent expected on larger configurations. The usable figure appears as recommendedMaxWorkingSetSize in the output.
What “CPU-only” really means. Metal is enabled by default on macOS, and --n-gpu-layers 0 disables GPU inference for a Metal build. The build documentation warns, though, that the GPU may still accelerate parts of the computation at -ngl 0. A CPU-only claim should therefore name the build as well as the flag.
Thread count. In a study of llama.cpp on an iPhone 15 Pro, throughput peaked when CPU threads matched the performance cores, and adding threads beyond that gave diminishing returns or lower performance. The peak was commonly at four or five threads. A CPU result run at the wrong thread count understates the CPU and flatters whatever it is compared against.
Model size changes the winner. The same iPhone study measured a CPU-only configuration (two threads, F16) at 17 tokens per second on a 1B model, against 12.8 with GPU acceleration. GPUs generally kept the lead above 1.5B parameters. The authors ran their tests ice-cooled and caution that the results may not generalise to other ARM mobile platforms, because of differences in caches, memory bandwidth and GPU efficiency. Their finding therefore covers this phone under these thermals.
Fixed per-token overhead. Mozilla.ai measured a near-constant host overhead per generated token of about 0.4 ms on a Mac, 1.8 ms on an L40S and 5.4 ms on a Steam Deck. The same overhead is a large percentage on a fast model and a small one on a slow model. Percentage gaps between platforms therefore shrink or grow with model size even when nothing about the GPUs has changed.
Thermals. Sustained real-world workloads cause heat build-up and frequency scaling, which the study’s ice-cooled runs did not reflect. On fanless or thin-chassis machines we would run tg long enough to reach steady state before recording it.
Before You Trust a llama.cpp Number: A Checklist
| Check | What to confirm | Why it matters |
|---|---|---|
| Build matches card | Native SASS for the exact GPU, no runtime-recompile line in the startup log | A PTX JIT fallback ran about 19% slower on generation in Paterson’s test |
| CMake cache clean | GGML_CUDA_FORCE_CUBLAS is set deliberately, not inherited |
A stale entry disabled MMQ, with a 5.7 to 6.3x pp gap on Blackwell |
| Toolkit version | The CUDA toolkit recommended for the architecture | CUDA 13.1 crashed or slowed MMQ on Blackwell |
| Offload | All layers on the GPU (-ngl 999 or all), confirmed in the log |
-ngl sets how many layers are kept in VRAM |
| Split mode | Tested against single-GPU, both layer and tensor where relevant | Interconnect speed can make multi-GPU slower |
| Context depth | -d set to the depth production will reach |
-d prefills the KV cache to that depth before the test |
| Repeats and spread | Warm-up discarded, mean and standard deviation reported | Published methods pre-warm against cold-start latency and repeat runs |
| Threads and memory | CPU threads at performance-core count; Apple GPU working-set limit checked | Both silently cap one side of a comparison |
When Does a llama.cpp Benchmark Result Carry over to Production Serving?
A llama.cpp benchmark result carries over to a production decision only when the hardware and the build match deployment. Mozilla.ai’s own advice is to benchmark on hardware resembling the deployment environment, because a result from a different setup may not predict the experience. Their benchmark also left out time to first token, end-to-end latency, model loading, memory use, power and concurrent requests, any of which could change the ranking.
Concurrency. LLM-Inference-Bench found that llama.cpp scales weakly with batch size and does not improve much at large batches, because the framework does not use compute resources well. The Bench360 authors evaluate single-stream, batch and server scenarios separately and conclude that the best engine depends strongly on the scenario. Their tested engines did not include llama.cpp, so they support the principle, not a llama.cpp ranking. To measure batched decoding in llama.cpp itself, llama-batched-bench has two modes. With separate prompts the KV cache must hold B×(PP+TG) tokens. With a shared prompt it holds PP+B×TG. For eight streams of 1,000 prompt tokens and 200 generated tokens, that works out to 9,600 versus 2,600 tokens of KV cache. A shared-prompt run therefore describes a much lighter load than eight users sending different prompts.
Server settings flatter or starve results. In llama-server, the context is divided among parallel slots. In one 2026 engine comparison, 32 slots at 1,024 tokens each fitted the test but would not fit real prompts, and the author suggests trading slots for context, for example -np 8 -c 32768. We would also vary prompt content between requests so identical prompts do not reuse earlier work. That same comparison warns that a queue like Ollama’s appears as time to first token, not as GPU utilisation, so both should be watched under real load.
Input and output shape changes the answer. LLM-Inference-Bench measured throughput for a 1,024-in, 128-out workload at 14.6 times that of a 128-in, 1,024-out workload, because input tokens are processed in parallel and output tokens one at a time. A hardware or cost decision should weight pp and tg by the ratio your real traffic has. Long documents, RAG and agents lean on pp, interactive chat on tg. The Blackwell write-up makes the same point: 152 tokens per second of generation on the cuBLAS fallback was sufficient for many uses, but the 5 to 6 times pp gap was noticeable in RAG and long-template systems.
Utilisation is not cost. Bench360 found that high GPU utilisation does not guarantee low energy cost, because engines can keep a device busy without using it well. For a per-token cost estimate we would measure energy and throughput at the target concurrency, not infer cost from a single-stream tg figure. The wider argument, that a leaderboard number is not your workload’s number, applies to llama.cpp as much as to any published chart. Sizing serving infrastructure for a SaaS product is where these measurements get used, as part of AI infrastructure and production SaaS engineering.
A Slow Result Is a Question, Not a Verdict
A disappointing llama-bench figure should start an investigation before it drives a purchase. The causes in this article (a JIT fallback, a cached cuBLAS flag) are build or configuration choices, not hardware limits. NVIDIA’s profile of Llama 7B in llama.cpp on an A100, before CUDA Graphs, found GPU idle gaps between tokens from CPU-side graph preparation and sampling, plus launch overheads between kernels. That is the level of evidence we would want before calling a card slow. The method is in profiling GPU kernels to find the real bottleneck, and if the decision is whether a model is worth porting at all, reading llama.cpp numbers before you port an LLM picks up from there. At Furball Factory, we would settle whether the gap comes from the hardware or from your build with a profile of your exact binary.