
Two phenomena, one word
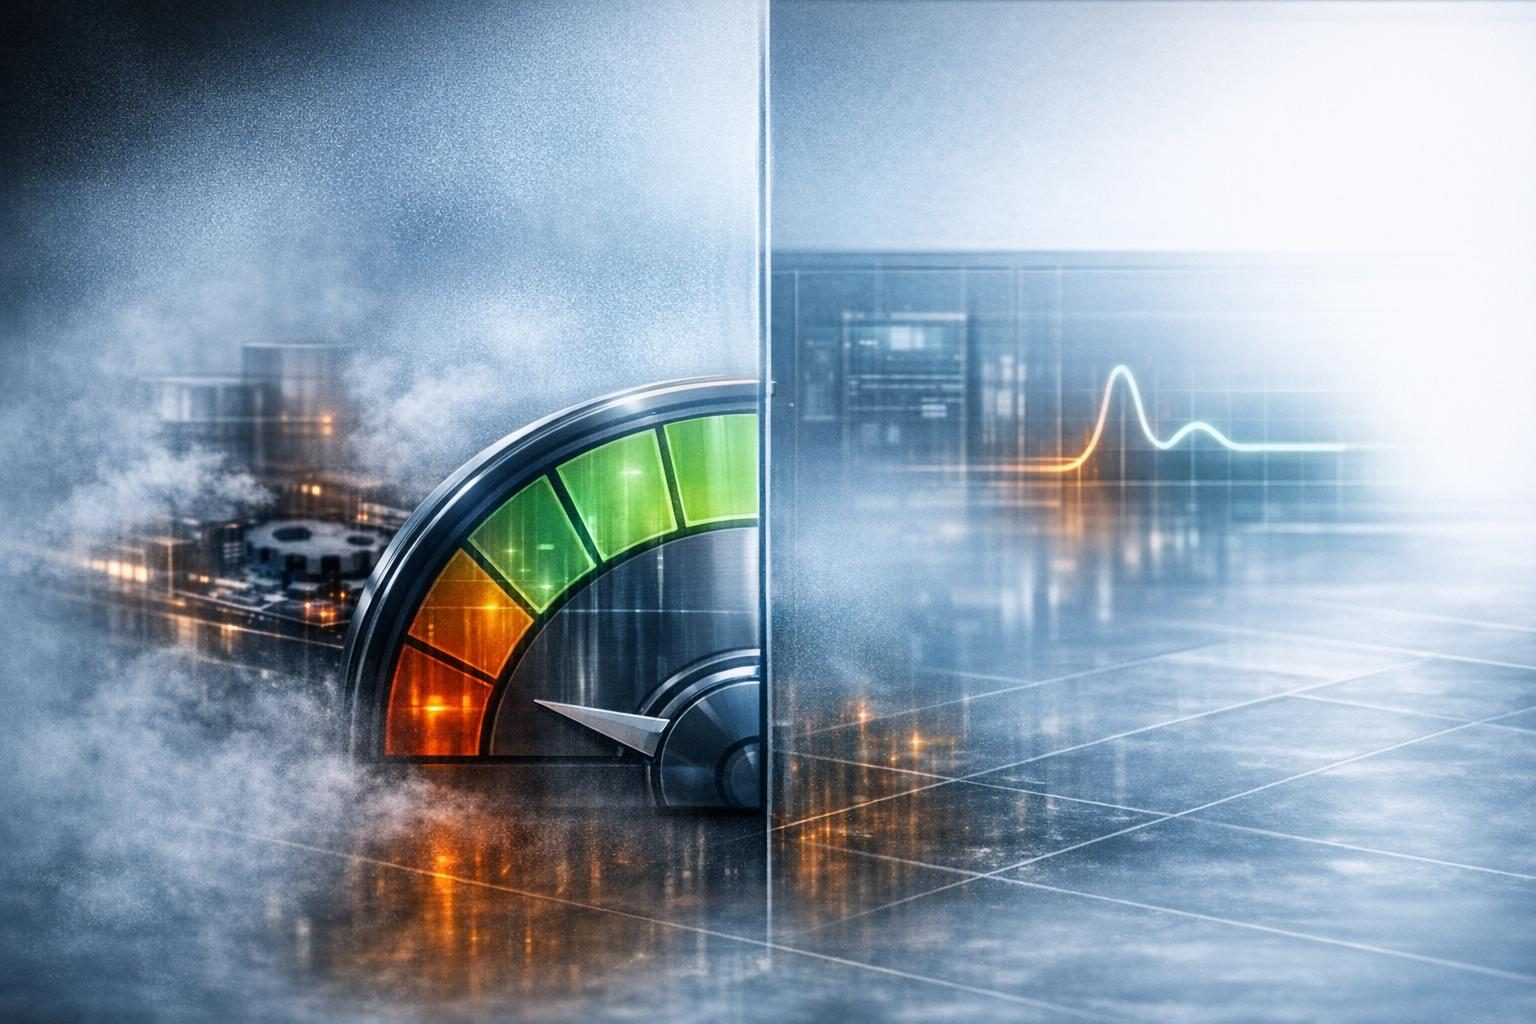
Performance has fallen noticeably since your AI system went live six months ago. Two different teams reach for the same word — “drift” — and mean two completely different things by it. The MLOps team means the model’s predictions have degraded against the same evaluation set; the platform team means the GPU’s tokens-per-second on the same model has shifted from where it benchmarked at install time. Both are real. Neither is the other. Conflating them produces root-cause analyses that look at the wrong layer of the stack.
Model drift and hardware-side performance change are independent axes of temporal change, with separate measurement methods, separate monitoring infrastructure, and separate remediation paths. The starting point for reasoning about either is to keep them apart.
How does model drift differ from hardware-side performance change?
As real-world inputs shift away from the original training distribution, model output quality erodes over time—this is model drift. The model itself does not change — its weights are static after training. What changes is the world the model is being applied to, and the model’s behavior on that shifting world deviates from its behavior on the data it was evaluated against at training time.
The drift literature distinguishes several mechanisms:
- Data drift (covariate shift): the distribution of input features changes. The relationship between inputs and the correct outputs may be unchanged, but the inputs the model sees in production no longer match the training distribution.
- Concept drift: the relationship between inputs and correct outputs changes. The same inputs would now warrant different outputs than they did at training time. This is the harder case because retraining requires labelled data from the new regime.
- Label drift: the distribution of correct outputs changes, often as a downstream effect of one of the above.
The measurement is on the model’s accuracy, calibration, or downstream business metric — not on the accelerator’s throughput. The remediation is data-side: retraining, fine-tuning, or input preprocessing changes. No hardware action addresses model drift. In our experience, this is the harder kind of drift to instrument well, because the labels you need to confirm degradation are exactly the labels you don’t have at production rate.
What hardware-side performance change actually is
On the hardware side, we track performance changes through warmup curves, thermal states, scheduling variations, runtime patches, and the AI Executor’s gradually shifting throughput on identical models, as detailed in why AI performance changes over time. The model is unchanged. The accelerator’s silicon is unchanged. What changes is some combination of:
- The thermal regime the device is operating in — sustained heat raises the throttle floor over a long workload, and the steady-state clock can sit meaningfully below the boost clock that an opening benchmark captured.
- The driver and CUDA/cuDNN runtime versions deployed on the host. A driver update that changes a scheduling heuristic or a kernel-selection table can move per-op latency on the same model by single-digit percentages without any notice in release notes.
- The framework version and the kernel libraries it dispatches to — PyTorch, TensorRT, ONNX Runtime, and the FlashAttention variant compiled against them.
- Co-tenant workload pressure on the host (CPU, memory bandwidth, PCIe topology, network), which is invisible to anything that only watches the accelerator.
- The cooling and power infrastructure of the data center itself, where a degraded chiller loop or a power-cap policy change reshapes the envelope every device on the rack is running inside.
The measurement is on the AI Executor’s throughput, latency distribution, or per-precision performance on a fixed workload — the executor being the device together with the backend, driver, framework, and runtime that drive it, not the silicon on its own. The remediation is platform-side: thermal investigation, driver/library version control, scheduling changes, or executor specification updates. No model action addresses hardware drift. We see this pattern regularly — the model is fine, the silicon is fine, and yet the system is twenty percent slower than it was at install time. The story lives in the layers between them.
The two are uncorrelated and require separate monitoring
| Property | Model drift | Hardware drift |
|---|---|---|
| What changes | Input distribution or input→output relationship | Executor’s effective throughput / latency on a fixed workload |
| What stays constant | Model weights, accelerator hardware, runtime | Model, weights, the workload definition |
| Detection signal | Accuracy / calibration / business-metric degradation on a held-out monitoring set | Throughput / p95 / p99 / energy-per-inference deviation from a reference benchmark |
| Required monitoring | Labelled (or proxied) production input + output distribution tracking | Periodic re-runs of a reference benchmark on the production executor |
| Remediation domain | Data and model lifecycle | Platform, driver, runtime, infrastructure |
| What it does NOT detect | Hardware drift; throughput regression looks normal to a model-quality monitor | Model drift; the model could be returning gibberish at full throughput |
These observed patterns form a decomposition, not a set of benchmarked magnitudes—their real contribution is the structural clarity they bring to detection signals.
The columns share no detection apparatus. A model-quality monitor that watches accuracy on a labelled production sample cannot detect that the accelerator now produces those same predictions at 60% of its prior throughput (as an illustrative failure scenario). A hardware benchmark that re-runs a reference workload cannot detect that the model’s predictions on that fixed workload are now systematically wrong on the production input distribution. Both monitoring systems are required to understand the operational performance of a deployed AI system over time, and a misattributed root cause — “the model is broken” when the throughput regressed, or “the GPU is slow” when the input distribution shifted — is the predictable failure mode when only one is in place.
Why benchmarks scope only to one of the two
Engineers measure the executor against a fixed workload using benchmark protocols. They are designed for that scope. A reference benchmark re-run quarterly on the production AI Executor is the right tool for detecting hardware-side performance change: the workload is held constant, so any deviation in the result is attributable to the executor.What such a run reports is narrow on purpose. A LynxBenchAI test discards a warm-up phase, then counts completed iterations inside one continuous timed measurement window, at a workload size already raised until throughput stops improving inside a defined noise band. Each test is one declared window rather than a median across repeated trials, and it asserts nothing about the machine’s temperature or clock behaviour inside that window — the integrity of the figure comes from the window being declared, not from it being long. One window is one window: it does not characterise variance across a day, a chassis, or a season, and figures produced under different release names are not comparable, because the thing being measured changed between them.
The same protocol cannot detect model drift. The benchmark workload’s input distribution does not change, by design — that’s what makes the comparison valid across time. So the part of the system that drifts when input distribution shifts (the model’s accuracy on production inputs) is precisely the part the benchmark holds constant. A benchmark that tried to detect model drift would have to vary its workload over time, which would also break its ability to detect hardware drift.
The methodological consequence is that benchmark methodology is the right tool for the hardware-drift question and the wrong tool for the model-drift question. Model drift requires production-monitoring instrumentation: held-out evaluation sets refreshed against production data, prediction-distribution tracking, and (where labels are available) accuracy regression alerts. These are different infrastructure than benchmark re-runs.
Neither side, on its own, tells the operator whether the system is degrading in a way that matters. A benchmark that says throughput is steady does not mean the predictions are still correct on this quarter’s traffic. A model-quality monitor that says accuracy is steady does not mean the executor is still delivering those answers within the latency budget the product was built around. The two reports are complementary, and they answer different questions.
The framing that helps
Hardware drift and model drift evolve along separate temporal dimensions. They have separate causes, separate detection signals, separate remediation paths, and separate monitoring infrastructure. A deployed AI system needs both kinds of monitoring; conflating them produces misattributed root-cause analyses; and a benchmark methodology — by holding the workload constant — is structurally scoped to the hardware-side axis only.
LynxBenchAI is a benchmark methodology for the hardware-side temporal axis: re-running a reference workload on the AI Executor to detect changes in throughput, latency distribution, and per-precision performance. It is intentionally scoped to that axis, because the model-side axis requires a different instrumentation approach that benchmark methodology does not — and should not — try to substitute for. That scoping is also why an argument about drift on one specific machine can stop being an argument: pip install lynxbench-ai on Python 3.11+, Linux or Windows via WSL2, 15–30 minutes, and the free Personal Edition produces a number with a stated scope rather than a recollection of what the box used to do. For the next “the model got slower” ticket, which axis is the dashboard signal actually surfacing — hardware-side throughput drift against a held-constant reference workload, or input-distribution shift against a held-constant executor — and is the right metric for this workload the benchmark re-run, the production-monitoring instrument, or both held apart on purpose? [Engineering note: the failure class named here is monitoring-axis conflation; the artifact built against it is the reference-benchmark re-run protocol that scopes itself to the hardware-side axis on purpose.]
Frequently Asked Questions
When someone asks whether a GPU “degrades over time”, are they describing worn-out silicon or something else?
Almost always something else. Consumer and datacenter accelerators do not measurably lose throughput to silicon wear on the timescales operators care about; what moves the number is the AI Executor around the device — thermal regime, driver and CUDA/cuDNN versions, framework and kernel-library changes, co-tenant pressure, and facility power or cooling policy. That is hardware-side drift, and it is detected by re-running a fixed reference workload, not by inspecting the chip. If the outputs themselves got worse rather than slower, you are looking at model drift instead.
How do I measure inference time in PyTorch without reporting a number the system never sustains?
Naive timing loops report the wrong thing twice over: they time asynchronous CUDA work without synchronising, and they include the warm-up iterations where allocator, autotuner, and clock behaviour have not settled. Discard a warm-up phase, then count completed iterations inside one continuous timed window at a batch size already raised until throughput stops improving inside a defined noise band — which is exactly what a LynxBenchAI test does. Declare the window alongside the figure, because a number without a stated scope cannot be compared to anything later.
Is inference-time scaling the same question as performance drifting during a long run?
No. Inference-time scaling is a design choice about spending more compute per request — longer reasoning chains, more samples, larger context — and it changes the workload definition itself. Temporal drift is what happens to a fixed workload as thermal, power, scheduling, and software conditions evolve underneath it. Keeping them apart matters because scaling regressions are fixed in the model and serving policy, while drift is investigated in the platform layers.
Which drift does a re-run of a reference benchmark actually catch?
Only the hardware-side axis. The benchmark holds its input distribution and workload constant so comparisons stay valid across time, which is precisely why it cannot see input-distribution shift; the part that drifts under model drift is the part the benchmark pins down. Model drift needs held-out evaluation sets refreshed against production data, prediction-distribution tracking, and accuracy regression alerts where labels exist. We cover the structural split in the comparison table above.
When scores slide, check weights and silicon independently
Degraded accuracy might stem from quantization changes during model re-export or from silent ECC bit flips—start by running frozen weights on validated hardware, then isolate variables one by one. Is that executor close enough to yours for the result to mean anything?